Mastering Performance Monitoring: Solving the 'Heavy UI' Problem
The "Heavy UI" Anxiety: Why Your App Feels Slow
There's a specific kind of stress that comes when your application starts to feel "heavy." You type in a text box and there's a 100ms delay before the character appears. You click a tab and the screen freezes for half a second. You know it's probably a re-render loop or a main-thread block, but finding the source is like looking for a needle in a haystack of nested components.
This Performance Anxiety is a primary source of dev pain for the Senior React Engineer. You want to ship fast, but you're afraid that every new component is a potential performance regression. The standard browser tools are powerful but "heavy"—opening the Chrome Profiler often changes the very timing you're trying to measure.
The Secret: Integrated Performance Vitals
We built the Performance tab in DevConsole to be the "noise-canceling headphones" for your application's vitals. We wanted to make performance monitoring a passive, real-time activity rather than a specialized "audit."
1. Real-Time Render Tracking
Stop guessing which component is re-rendering. DevConsole’s Performance toolkit highlights components in real-time as they re-render, showing you the exact timestamp and duration. If a simple state change triggers a render of your entire component tree, you'll see it instantly in the overlay.
// DevConsole highlights this component on re-render:
const UserList = () => {
  // [Rendered: 12ms] - triggered by 'sortOrder' change
  return <ul>{...}</ul>;
};
2. Main-Thread Bottleneck Detection
Is a heavy data-processing task blocking your UI? DevConsole monitors the "Main Thread" and flags any blockages longer than 50ms (the threshold for human-perceived latency). See exactly which script or API call is causing the stutter without ever leaving your tab.
// DevConsole flags 'Long Task' detected:
// Duration: 120ms
// Source: processLargeDataset.js
3. Core Web Vitals in Dev Mode
Monitor your LCP (Largest Contentful Paint) and CLS (Cumulative Layout Shift) as you interact with the app locally. Catch layout shifts caused by "slow-loading" images or missing skeleton states before they ever reach a real-world user.
# Live Core Web Vitals in Overlay:
LCP: 1.1s (GOOD)
CLS: 0.08 (GOOD)
FID: 12ms (GOOD)
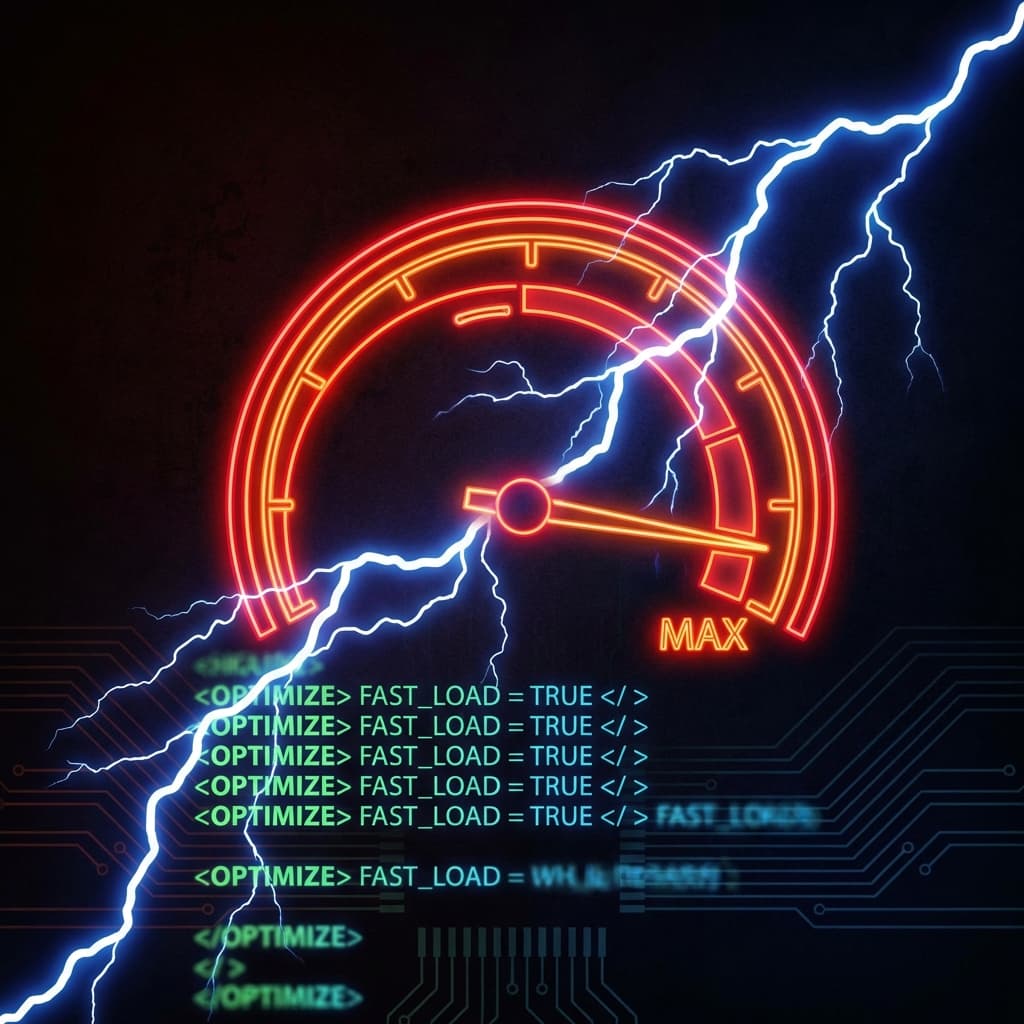
The ROI of Speed: Performance is a Feature
When your app is fast, your users are happy. It's that simple.
- Improved SEO Rankings: Passing Core Web Vitals is a direct boost to search visibility.
- Higher Conversion Rates: Even a 100ms improvement can significantly increase user engagement.
- Reduced Support Tickets: A stable, responsive UI leads to fewer "frustration errors" from users.
Internal Backlinks: Level Up Your Vitals
- The Silent SEO Killer: How performance impacts Your Search Rankings.
- Beyond the Browser: Why traditional tools Fail Modern React Teams.
- The Senior Slog: Why manual optimization Leads to Burnout.
External References
- Google Developers: Official guide on Core Web Vitals.
- web.dev: How to Identify and Fix Cumulative Layout Shift.
- React Documentation: Tips for Optimizing Performance.
Frequently Asked Questions (FAQs)
Does DevConsole impact the performance it's trying to measure?
No! This is one of our biggest engineering achievements. DevConsole uses a specialized "passive observer" pattern that runs in a way that minimizes its own impact on the main thread. We've designed it to be lightweight enough that its measurements are as accurate as possible to the real-world performance of your application.
How is DevConsole's performance tab different from Chrome's Profiler?
Chrome's Profiler is a "deep dive" tool—it's great for identifying which specific line of JS is taking 5ms to run. DevConsole is a "surface level" tool—it tells you what is happening in the context of your application (e.g., "The Dashboard Tab is re-rendering twice on every click"). DevConsole helps you find the problem area in seconds, so you only use the Chrome Profiler when you need a surgical investigation.
Can DevConsole detect "Layout Shifts" caused by external scripts?
Yes! Our Performance toolkit monitors the entire DOM for unexpected shifts. If an analytics script or an ad network pushes your content down by 50px, DevConsole will flag it as a CLS event, allowing you to identify and fix the issue before it impacts your SEO.
Will DevConsole help me with Next.js Hydration timing?
Absolutely. We have specialized hooks for Next.js that surface the exact time it takes for your application to become interactive (TTI). You can see the impact of your useLayoutEffect hooks and your heavy hydration payloads directly in the overlay.
Does the performance tab work on actual mobile devices?
Yes! Since DevConsole is an inline overlay, you can open it on your phone (via a local network connection to your dev-server). This is the best way to see how your app actually performs on mobile hardware, which is often 5-10x slower than your development machine.
How do I share a performance bottleneck with my team?
DevConsole allows you to export a "Performance Trace." This file captures the render timeline and main-thread activity of a specific interaction. You can share this with your team so they can "playback" the performance issue on their own machines.
Conclusion: Stop Guessing, Start Measuring
You shouldn't have to wait for a Lighthouse report to know if your app is slow. By bringing real-time performance vitals directly into your application with the DevConsole Toolkit, you eliminate the guesswork and ship a product that feels as fast as it looks. Take control of your "Heavy UI" and start engineering for speed.
Start monitoring your vitals today and never ship a slow UI again.


